Short answer
Sometimes maxing out a 401(k) is enough. Often it is not. The contribution limit itself cannot tell you which.
For 2026, the employee elective-deferral limit is $24,500. Workers who reach age 50 by year end can generally add $8,000 on top, and those who turn 60, 61, 62 or 63 during 2026 may be able to add $11,250 instead, if their plan offers those features. Those figures come from IRS Notice 2025-67.
What none of those limits know is your age, your current balance, your mortgage, your expected retirement date, your spouse’s plan, whether you get a pension, what your employer contributes, or how long you will live. The limit is a tax rule. Retirement readiness is a cash-flow projection. Confusing the two is one of the easiest ways for an otherwise diligent saver to mistake a milestone for a plan.
There is useful context here. According to Vanguard’s How America Saves 2026, about 14% of participants reached the statutory maximum in 2025. If you are maxing, you are already in a relatively small group. That is worth acknowledging before asking whether you should be doing more.
The 2026 numbers, and which ones are actually limits
| 2026 figure | Amount | What it governs |
|---|---|---|
| Employee elective deferral (§402(g)) | $24,500 | Your own pre-tax and Roth elective deferrals combined, across applicable plans during the year. |
| Age 50+ catch-up (§414(v)) | $8,000 | Additional employee contribution if the plan offers catch-ups. Potential employee ceiling: $32,500. |
| Age 60–63 catch-up | $11,250 | Replaces the regular catch-up tier for eligible participants ages 60 through 63, if offered. Potential employee ceiling: $35,750. |
| Annual additions limit (§415(c)) | $72,000 | Employee deferrals, employer contributions, voluntary after-tax contributions and certain other additions, or 100% of compensation if lower. |
| §415(c) plus regular catch-up | $80,000 | Catch-up contributions sit on top of the annual additions limit. |
| §415(c) plus age 60–63 catch-up | $83,250 | Same mechanism, with the higher catch-up tier. |
| Compensation limit (§401(a)(17)) | $360,000 | Maximum compensation a qualified plan may count when calculating contributions subject to this limit. |
| Roth catch-up wage threshold | $150,000 | Prior-year Social Security wages from the plan sponsor above this threshold can trigger Roth-only catch-up treatment in 2026. |
Three items in that table are commonly mixed together.
The $24,500 limit follows the participant. If you change jobs during the year, your combined elective deferrals across applicable 401(k), 403(b), SARSEP and SIMPLE arrangements generally cannot exceed your annual §402(g) limit. A governmental 457(b) plan has a separate deferral limit, which is one reason job changes and multiple plans require more attention than a single payroll screen suggests.
The $72,000 limit measures something different. Employer matching and profit-sharing contributions do not normally use up your $24,500 employee elective-deferral limit, but they generally count toward the broader annual-additions limit. If you defer $24,500 and your employer contributes $15,000, you have used $39,500 of the $72,000 limit. Whether you can do anything with the remaining space depends on the features of your plan.
The $360,000 compensation limit matters more as income rises. Once compensation counted by the plan reaches that ceiling, an employer contribution expressed as a percentage of compensation stops scaling with additional salary. For high earners, that can make the workplace plan a progressively smaller part of the total savings picture.
The catch-up rule that changed in 2026
Beginning with the 2026 tax year, catch-up contributions generally must be made as designated Roth contributions when the participant’s prior-year Social Security wages from the employer sponsoring the plan exceeded $150,000. The statutory requirement took effect for taxable years beginning after December 31, 2025. Treasury and the IRS issued final regulations in 2025 that generally apply for taxable years beginning after December 31, 2026, with transition and good-faith implementation rules applying before then. See the IRS summary of the final regulations.
The practical consequence is more than a label change. If you are affected, the catch-up amount you might previously have treated as pre-tax may no longer reduce current taxable income. At a 35% marginal rate, an $8,000 Roth catch-up instead of a deductible pre-tax catch-up changes current-year tax by roughly $2,800 before state effects. That does not make Roth treatment bad; it means the cash-flow and withholding consequences are different.
The threshold is measured per employer using the relevant prior-year Social Security wages, not household income. And catch-up features are plan-dependent. If your plan does not offer the relevant catch-up or Roth feature, the practical result can differ from what a generic contribution-limit chart implies.
The percentage problem
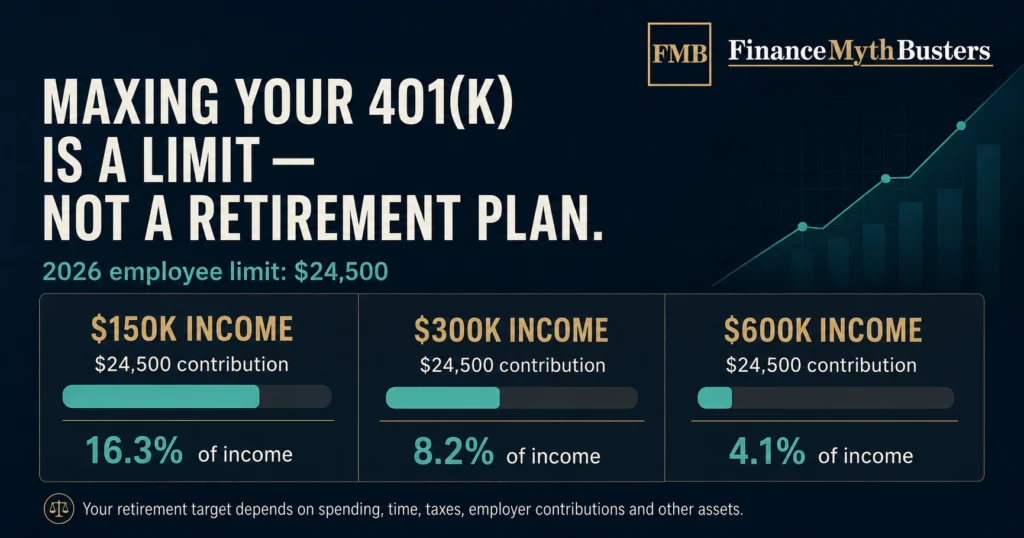
Two people each contribute $24,500. One earns $150,000, so the employee contribution is about 16.3% of gross pay. The other earns $300,000, so it is about 8.2%.
Same statutory maximum. Very different savings rate.
The high-earner issue becomes more visible when employer contributions are included. Assume a straightforward employer contribution of 5% of compensation counted by the plan:
| Salary | $24,500 as % of pay | Employer contribution at 5% | Combined rate |
|---|---|---|---|
| $120,000 | 20.4% | $6,000 | 25.4% |
| $150,000 | 16.3% | $7,500 | 21.3% |
| $200,000 | 12.3% | $10,000 | 17.3% |
| $300,000 | 8.2% | $15,000 | 13.2% |
| $400,000 | 6.1% | $18,000 (capped) | 10.6% |
| $600,000 | 4.1% | $18,000 (capped) | 7.1% |
FMB illustration. Assumes a 5% employer contribution on compensation counted up to the 2026 §401(a)(17) limit of $360,000 and full use of the employee elective-deferral limit. Excludes catch-up contributions and voluntary after-tax contributions. Actual plan formulas and vesting rules vary.
Above $360,000 of compensation counted by the plan, the illustrated employer contribution flatlines while salary keeps rising. The workplace plan does not merely become a smaller share of income; it stops responding to additional income under this simplified formula.
None of this automatically means a $600,000 earner is under-saving. They may have a spouse’s plan, taxable investments, deferred compensation, a pension, business equity or other assets. That is precisely the point. Once the workplace plan stops scaling, “I max my 401(k)” carries less information about whether the household is actually on track.
For a broad benchmark, Vanguard reports an average participant deferral rate of 7.6% in 2025 and an average total contribution rate of 12.1% when employer contributions are included, with a median total rate of 11.6%. Vanguard also uses roughly 12% to 15% of pay, including employer contributions, as a general planning benchmark. Treat that as a screening tool published by a recordkeeper, not a rule and not a personalized retirement answer.
What actually determines whether you are saving enough
Retirement readiness is the relationship between four things: what you expect to spend, what you already have, what you keep adding, and how long the money has to work before and after you stop earning. Everything else feeds into one of those four.
Expected spending does more work than most people realize. A household that expects to spend $120,000 a year in retirement and a household that expects to spend $220,000 need radically different portfolios even if both earn the same amount today. Current salary is not the target. Future spending is closer to the target.
Timing changes both sides of the equation. Retiring at 60 rather than 67 removes seven years of contributions and compounding while adding seven years of withdrawals. It may also create a bridge period before Social Security begins.
Guaranteed income reduces the burden on the portfolio. Social Security, pensions and other dependable income do not eliminate portfolio risk, but every dollar of dependable income is a dollar the portfolio does not need to produce. For 2026, the Social Security Administration lists a maximum benefit of $4,152 per month for a worker retiring at full retirement age and an estimated average retired-worker benefit of $2,071 per month after the 2.8% COLA. Those figures are not promises for a particular household; they show why guaranteed income should not be omitted from the calculation.
Taxes affect what a balance can actually buy. A $3 million traditional 401(k) and a $3 million Roth portfolio do not provide the same after-tax spending power. For high earners, tax treatment can materially change the apparent margin in a retirement projection.
Worked example one: the household where maxing is enough, until it isn’t
The setup. A married couple, both age 42, earns $340,000 combined. Both max the employee deferral, so they contribute $49,000 between them. Employer contributions total $17,000. Current invested retirement assets are $650,000. They plan to retire at 62 and expect to spend $180,000 a year in today’s dollars. They intend to claim Social Security at 67 and plan around a combined $75,000 annual benefit in today’s dollars.
Stated assumptions. Figures use a 4.5% real return, meaning the return is modeled net of inflation and values are shown in today’s dollars. Contributions remain constant in real terms and are treated as end-of-year. Catch-up contributions from age 50 are excluded. This is an illustration, not a forecast, and actual returns can be lower or negative.
| Component | Value at 62 (today’s dollars) |
|---|---|
| Existing $650,000 grown for 20 years | About $1,567,600 |
| $66,000 a year contributed for 20 years | About $2,070,500 |
| Projected portfolio | About $3,638,100 |
From age 62 to 67, the portfolio must fund the full $180,000 annual spending target. From 67 onward, the modeled portfolio need falls to $105,000 a year after the assumed $75,000 Social Security benefit.
Capitalizing the ongoing $105,000 need at a 4% withdrawal rate gives a rough $2,625,000 requirement at age 67. Discounting that five years to age 62 and adding the five-year spending bridge produces an illustrative requirement of about $2,932,200.
Against a projected $3,638,100 portfolio, the household appears to be ahead by about $706,000. Under those assumptions, maxing is enough.
Now add a tax assumption. If most of the balance is pre-tax, spending $180,000 can require more than $180,000 of gross withdrawals. Using a purely illustrative 18% blended effective tax rate on portfolio withdrawals produces a much thinner margin:
| Planning assumption | Requirement at 62 | Position |
|---|---|---|
| 4.0% withdrawal rate, taxes ignored | About $2,932,200 | About $705,900 ahead |
| 4.0% withdrawal rate, 18% blended tax | About $3,575,800 | About $62,300 ahead |
| 3.5% withdrawal rate, 18% blended tax | About $3,942,800 | About $304,700 short |
Same household. Same contributions. Same maxed-out 401(k)s. The conclusion flips when two assumptions change. That is what “it depends” means in this context: the dependency is arithmetic, not rhetoric.
Worked example two: the household where maxing is not enough
The setup. A married couple, both age 47, earns $420,000 combined. Both max, so they contribute $49,000, plus $22,000 in employer contributions. Current invested retirement assets are $520,000 because serious saving started later. They want to retire at 60 and expect to spend $190,000 a year. Social Security begins at 67, modeled at $80,000 combined.
Using the same 4.5% real-return method and excluding catch-ups, the portfolio projects to about $2,139,900 at age 60.
The modeled requirement is far larger because the household has a seven-year bridge before Social Security and a high spending target. At a 4% withdrawal rate, the illustrative requirement is about $3,190,800. At 3.5%, it is about $3,479,500 before any tax adjustment.
That leaves a shortfall of roughly $1.05 million to $1.34 million before taxes. The household is maxing both plans, receiving employer contributions and carrying no assumed debt in the example. The plan still does not work because retirement age and spending are doing more work than the contribution ceiling.
Hold the contribution behavior constant and change only retirement age to 65 and spending to $150,000. Five additional years of saving and compounding increase projected assets to about $3,055,100, while the shorter bridge and lower ongoing spending reduce the modeled requirement to about $1,896,100. The same household moves from a seven-figure shortfall to a seven-figure cushion without changing the annual employee contribution.
For someone already at the statutory maximum, retirement age and expected spending can be more powerful levers than the next account opened.
Time, and why the same maximum is not the same contribution
Contribution timing compounds in a way the annual limit conceals. Consider $24,500 contributed each year at a hypothetical 6% nominal return:
| Years of contributions | Nominal value |
|---|---|
| 20 years | About $901,000 |
| 30 years | About $1,937,000 |
| 40 years | About $3,792,000 |
Assumes end-of-year contributions, a constant 6% nominal return, no fees, no taxes, no change in contribution amount and no future increase in IRS limits. These are nominal dollars, so future purchasing power would be lower than the headline balance suggests.
Someone maxing from age 25 and someone maxing for the first time at 45 are performing the same annual action with the same tax-code ceiling, but time makes the outcomes fundamentally different.
When maxing your 401(k) may be enough
Maxing tends to clear the bar more often when a household started early enough for compounding to do much of the work, receives meaningful employer contributions or pension income, expects retirement spending materially below current gross income, is not planning to retire far ahead of Social Security, and holds assets outside the 401(k) as well.
Income by itself does not answer the question. A $160,000 earner maxing from age 27 with a strong employer contribution can be in a stronger position than a $450,000 earner who first began maxing at 44.
When maxing your 401(k) may not be enough
The reverse pattern shows up when income grew much faster than the savings rate, serious saving started later, retirement is planned well before Social Security, employer contributions are small, nearly everything is pre-tax, or expected retirement spending remains close to current lifestyle spending.
Any one of those may be manageable. Several at once can make the statutory maximum insufficient even when the dollar contribution feels large.
If you cannot max your 401(k)
Not reaching $24,500 is not a retirement-planning failure. In Vanguard’s 2025 participant data, roughly 14% reached the statutory maximum. Maxing is the exception, not the baseline.
Capture the full employer contribution first. If an employer matches 50% on the first 6% of pay and you contribute only 4%, you are leaving part of the available employer contribution unused. That can matter more than chasing a distant maximum.
Raise the rate on a schedule instead of waiting for a perfect year. Vanguard reports that 45% of participants increased their deferral rate in 2025, including 31% through automatic escalation. Gradual increases tied to raises can improve the long-term savings rate without requiring one abrupt jump.
Know the number you are trying to fund. A household saving 11% consistently toward a realistic retirement-spending target can be in better shape than a household maxing toward a target it has never calculated.
What to look at after you max
There is no correct universal account order. The right sequence depends on your tax rate now versus later, liquidity needs, employer-plan features, debt, insurance and what you are saving for besides retirement.
Employer contributions and vesting. Confirm that you are capturing the full benefit and understand the vesting schedule before making employment decisions.
High-interest debt and cash reserves. Liquidity has real value. If the household has no meaningful cash buffer, use FMB’s Emergency Fund Target to estimate a reserve range before treating every extra dollar as long-term retirement capital.
HSA, if eligible. For 2026, the HSA contribution limits are $4,400 for self-only coverage and $8,750 for family coverage, with an additional $1,000 available beginning at age 55. The health plan itself must still be appropriate for the household; the tax treatment does not make every high-deductible plan a good choice.
IRA or Roth strategy. The 2026 IRA contribution limit is $7,500, plus a $1,100 catch-up beginning at age 50. Direct Roth IRA contributions phase out at higher incomes, which is why some higher-income households evaluate a backdoor Roth strategy and the pro-rata rule.
Voluntary after-tax 401(k) contributions. If your plan offers them, they can use remaining §415(c) space and may support a mega backdoor Roth strategy when the plan also provides a workable conversion mechanism.
Taxable brokerage. Taxable assets have no contribution limit or retirement-account access age and can be especially useful for households planning to retire before age 59½ or bridge the period before Social Security.
The tax-optimal answer is not always the best planning answer. A household that shelters every possible dollar but leaves itself without accessible capital can optimize the wrong variable.
Roth 401(k), after-tax 401(k), and the mega backdoor Roth
These terms are often conflated even though they refer to different contribution categories.
A Roth 401(k) contribution is an elective deferral. It uses the same $24,500 employee elective-deferral limit as a pre-tax 401(k) contribution. Choosing Roth changes the tax treatment; it does not create extra employee-deferral room.
A voluntary after-tax contribution is different. It is not an elective deferral, so it does not consume the $24,500 limit, but it does count toward the $72,000 annual-additions limit.
A mega backdoor Roth depends on plan features. The common structure requires voluntary after-tax contributions plus a practical way to move those contributions into Roth treatment, such as an in-plan Roth conversion or an in-service distribution. Without the necessary plan features, the strategy is not available.
| Item | Amount |
|---|---|
| 2026 §415(c) annual-additions limit | $72,000 |
| Less employee elective deferrals | ($24,500) |
| Less employer contributions | ($12,000) |
| Potential voluntary after-tax space | $35,500 |
Illustrative only. Subject to plan provisions, compensation rules, actual employer contributions and nondiscrimination testing. Many plans permit no voluntary after-tax contributions.
A better readiness test than “Did I max?”
Once a year, run five numbers:
- Expected annual retirement spending in today’s dollars. Build it from the expenses you expect to keep, remove and add. Include healthcare before Medicare if you plan to retire early.
- Current invested assets. Include retirement and taxable investment accounts. Do not automatically count home equity unless the plan actually uses it.
- Total annual contributions. Include your contributions, your spouse’s contributions and vested employer money. Express the total as both dollars and a percentage of gross income.
- Years until retirement and years until guaranteed income begins. If retirement starts before Social Security or a pension, model the bridge explicitly.
- The portfolio funding gap. Expected spending minus dependable income is the amount the portfolio must cover. Test more than one withdrawal-rate and tax assumption so you can see how sensitive the answer is.
Compare the target with what your existing assets and planned contributions are projected to produce. If the projection clears the target with a reasonable margin, maxing may be enough for you. If it does not, you now know the approximate size of the shortfall and can evaluate whether the better lever is another account, a later retirement date, a lower spending target, or some combination.
FMB’s Annual Financial Checkup can help you review retirement alongside cash flow, reserves, debt, taxes, insurance and other priorities instead of treating the 401(k) in isolation.
The point is not false precision. Every input will change. The point is to make decisions against a number you calculated rather than a contribution ceiling Congress indexed for inflation.
Maxing out your 401(k) is a milestone worth reaching. It is not a personalized retirement finish line, because the contribution limit was never measuring the distance.